天软金融分析.NET函数大全 > 金融函数 > 技术分析 > 主图指标
蜡烛线
KLineBetweenDay
简述
区间段K线
蜡烛线
定义
KLineBetweenDay(BegT:TDateTime;EndT:TDateTime;N1:Integer;N2:Integer;N3:Integer;N4:Integer);Graph
参数
| 名称 | 类型 | 说明 |
|---|---|---|
| BegT | TDateTime | 开始日期 |
| EndT | TDateTime | 截止日期 |
| N1 | Integer | 整数 |
| N2 | Integer | 整数 |
| N3 | Integer | 整数 |
| N4 | Integer | 整数 |
| 返回 | Graph | 图形 |
- 范例SetSysParam(pn_stock(),'SH000001');
Return KLineBetweenDay(inttodate(20130501),inttodate(20130706),5,10,20,60);
//结果: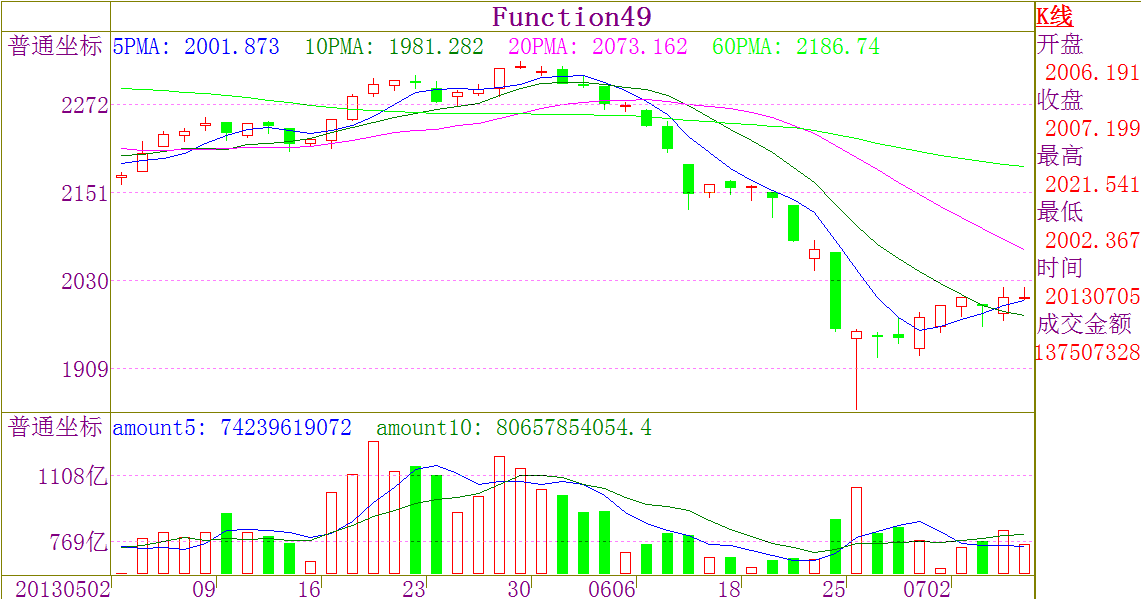
相关