天软金融分析.NET函数大全 > 金融函数 > 技术分析 > 动量指标 > 图形
1.本指标的超买超卖界限值随个股不同而不同,使用者应自行调整;
2.使用时,可列出一年以上走势图,观察其常态性分布范围,然后用参考线设定其超买超卖范围。通常UDL 高于某个极限时,短期股价会下跌;UDL 低于某个极限时,短期股价会上涨;
UDL
简述
引力线
1.本指标的超买超卖界限值随个股不同而不同,使用者应自行调整;
2.使用时,可列出一年以上走势图,观察其常态性分布范围,然后用参考线设定其超买超卖范围。通常UDL 高于某个极限时,短期股价会下跌;UDL 低于某个极限时,短期股价会上涨;
定义
UDL(N1:Integer;N2:Integer;N3:Integer;N4:Integer;M:Integer):Graph
参数
| 名称 | 类型 | 说明 |
|---|---|---|
| N1 | Integer | 整数 |
| N2 | Integer | 整数 |
| N3 | Integer | 整数 |
| N4 | Integer | 整数 |
| M | Integer | 整数 |
| 返回 | Graph | 图形 |
- 范例SetSysParam(pn_stock(),'SH000001');
SetSysParam(pn_date(),inttodate(20140123));
Return UDL(3,5,10,20,6);
//结果: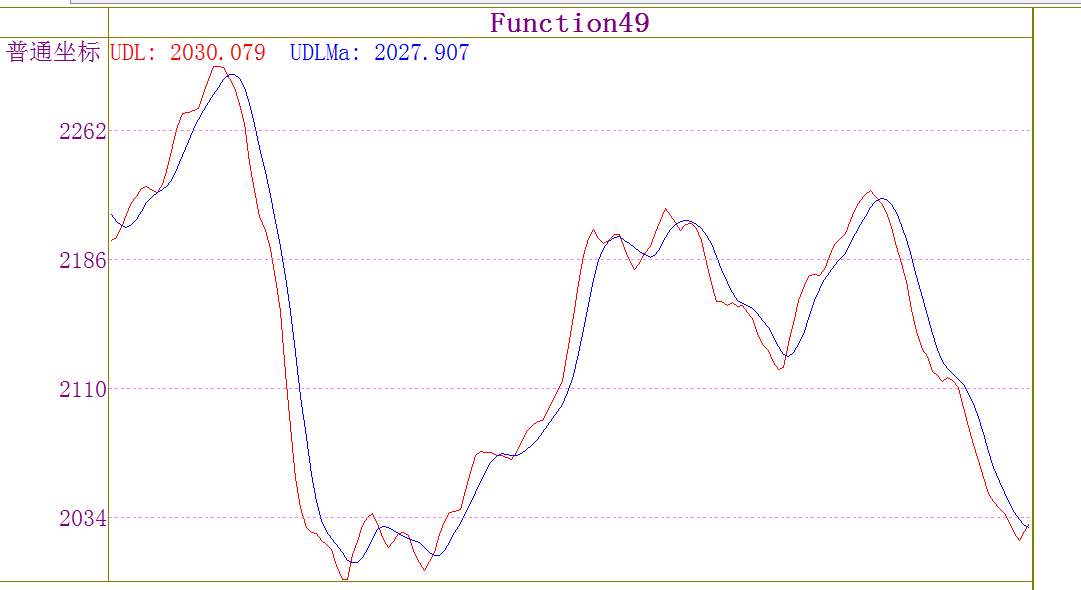
相关