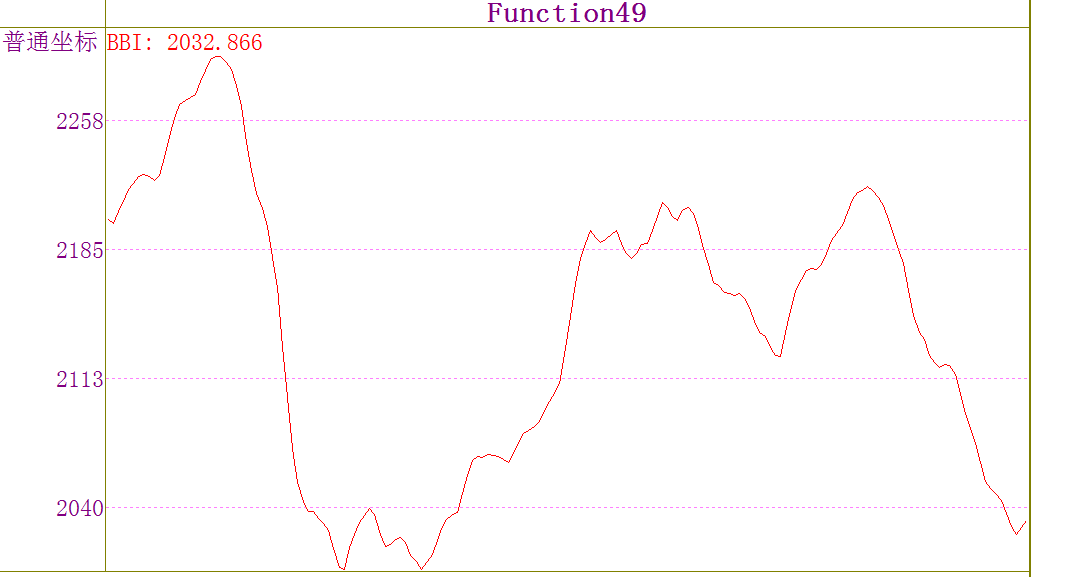
天软金融分析.NET函数大全 > 金融函数 > 技术分析 > 均线指标 > 图形
用法:
1.同移动平均线
2.高价区收盘价跌破BBI线,卖出信号
3.低价区收盘价突破BBI线,买入信号
4.BBI线向上,股价在BBI线之上,多头势强
5.BBI线向下,股价在BBI线之下,空头势强
BBI
简述
多空指标;主图叠加指标;3日平均价加6日平均价加12日平均价加24日平均价,其和除以四;
用法:
1.同移动平均线
2.高价区收盘价跌破BBI线,卖出信号
3.低价区收盘价突破BBI线,买入信号
4.BBI线向上,股价在BBI线之上,多头势强
5.BBI线向下,股价在BBI线之下,空头势强
定义
BBI(N1:Integer;N2:Integer;N3:Integer;N4:Integer):Graph
参数
| 名称 | 类型 | 说明 |
|---|---|---|
| N1 | Integer | 整数 |
| N2 | Integer | 整数 |
| N3 | Integer | 整数 |
| N4 | Integer | 整数 |
| 返回 | Graph | 图形 |
- 范例
SetSysParam(pn_stock(),'SH000001');
SetSysParam(pn_date(),inttodate(20140123));
Return BBI(3,6,12,24);
//结果:
相关